

BLNO MEN · 2026/27
 Fyllingen
RECORD
6-2
ORTG
124.3 (1st)
DRTG
92.9 (2nd)
NET
31.4 (1st)
PACE
87.9 (3rd)
Season games
| DATE | MATCHUP | SCORE | REPORT |
|---|---|---|---|
| 08 Nov | Tromsø Storm vs Fyllingen | 81–116 | Open report → |
| 31 Oct | Fyllingen vs Bærum Basket | 116–78 | Open report → |
| 24 Oct | Fyllingen vs Ammerud BLNO | 102–96 | Open report → |
| 18 Oct | Kongsberg Miners vs Fyllingen | 99–67 | Open report → |
| 11 Oct | TNT Towers vs Fyllingen | 91–153 | Open report → |
| 10 Oct | Nidaros Jets vs Fyllingen | 61–142 | Open report → |
| 26 Sept | Fyllingen vs Tromsø Storm | 110–68 | Open report → |
| 20 Sept | Fyllingen vs Gimle | 68–80 | Open report → |
Advanced profile
eFG%57.4% (3rd)
TS%60.2% (3rd)
TOV%9.7% (1st)
ORB%30.6% (5th)
FTr30.1% (4th)
NHA LAB · BLNO MEN
Trends and scouting
From validated game data in the 2026/27 season.
NET · Offensive rating minus defensive rating.
Each point is one game. Interpret trends only as the sample grows.
Player portraits
Official player profile photos · NBBF and Ammerud Basket
Game pace · Season
Possessions use the standard box-score estimate: FGA − ORB + TOV + 0.44 × FTA. Pace is the average of both teams’ estimated possessions; seconds per possession uses the 40-minute BLNO game length.
| GAME | TEAM POSS | GAME PACE | EST. SEC/POSS | REPORT |
|---|---|---|---|---|
| Tromsø Storm vs Fyllingen | 90.8 | 91.4 | 26.4s | Open report → |
| Fyllingen vs Bærum Basket | 83 | 83 | 28.9s | Open report → |
| Fyllingen vs Ammerud BLNO | 83.2 | 84.9 | 28.8s | Open report → |
| Kongsberg Miners vs Fyllingen | 81.2 | 81.1 | 29.5s | Open report → |
| TNT Towers vs Fyllingen | 102.2 | 100.7 | 23.5s | Open report → |
| Nidaros Jets vs Fyllingen | 96.5 | 94.2 | 24.9s | Open report → |
| Fyllingen vs Tromsø Storm | 89.8 | 89 | 26.7s | Open report → |
| Fyllingen vs Gimle | 76.2 | 79 | 31.5s | Open report → |
Season roster
Click any header to order the roster.
| Kalob James Ledoux | 7 | 22.6 | 4 | 4.9 | 25.5 |
 Lars Andreas Nilsen | 7 | 21.1 | 2 | 1.9 | 24.1 |
 Davonte Ray Davis | 8 | 19.6 | 6.5 | 6.1 | 22.3 |
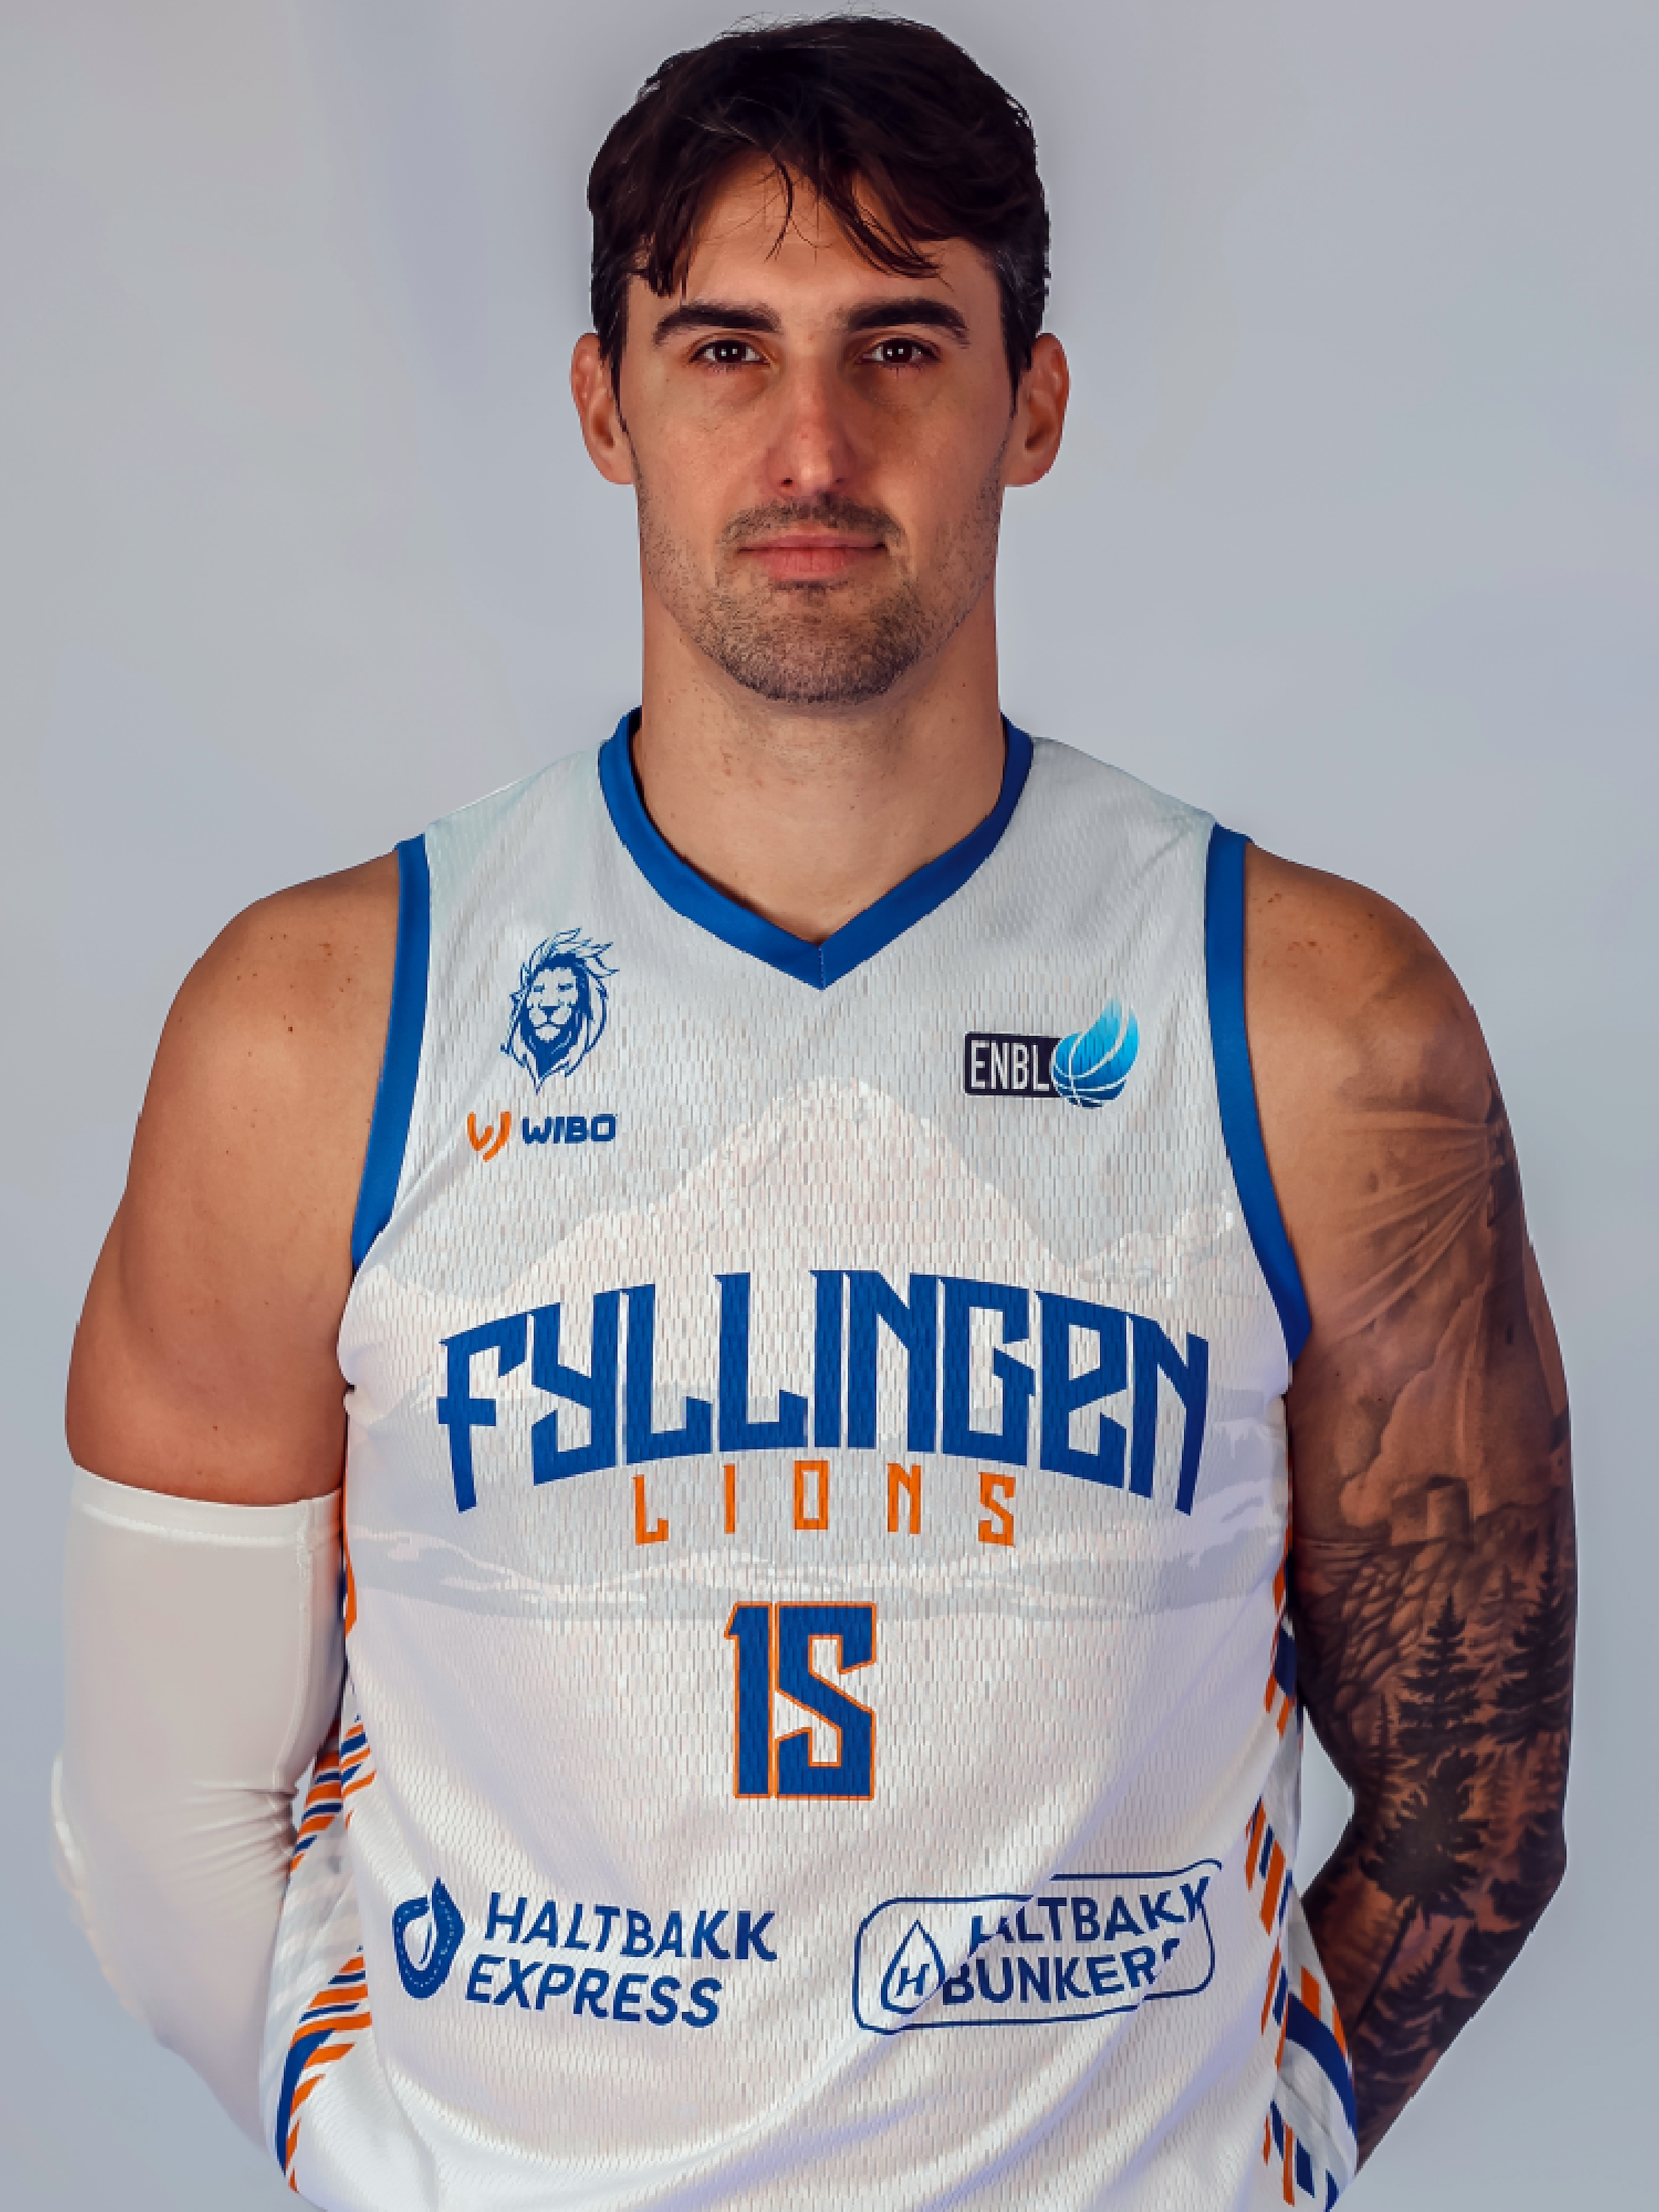 Troy Barnies | 8 | 16.1 | 6.4 | 1.9 | 18.4 |
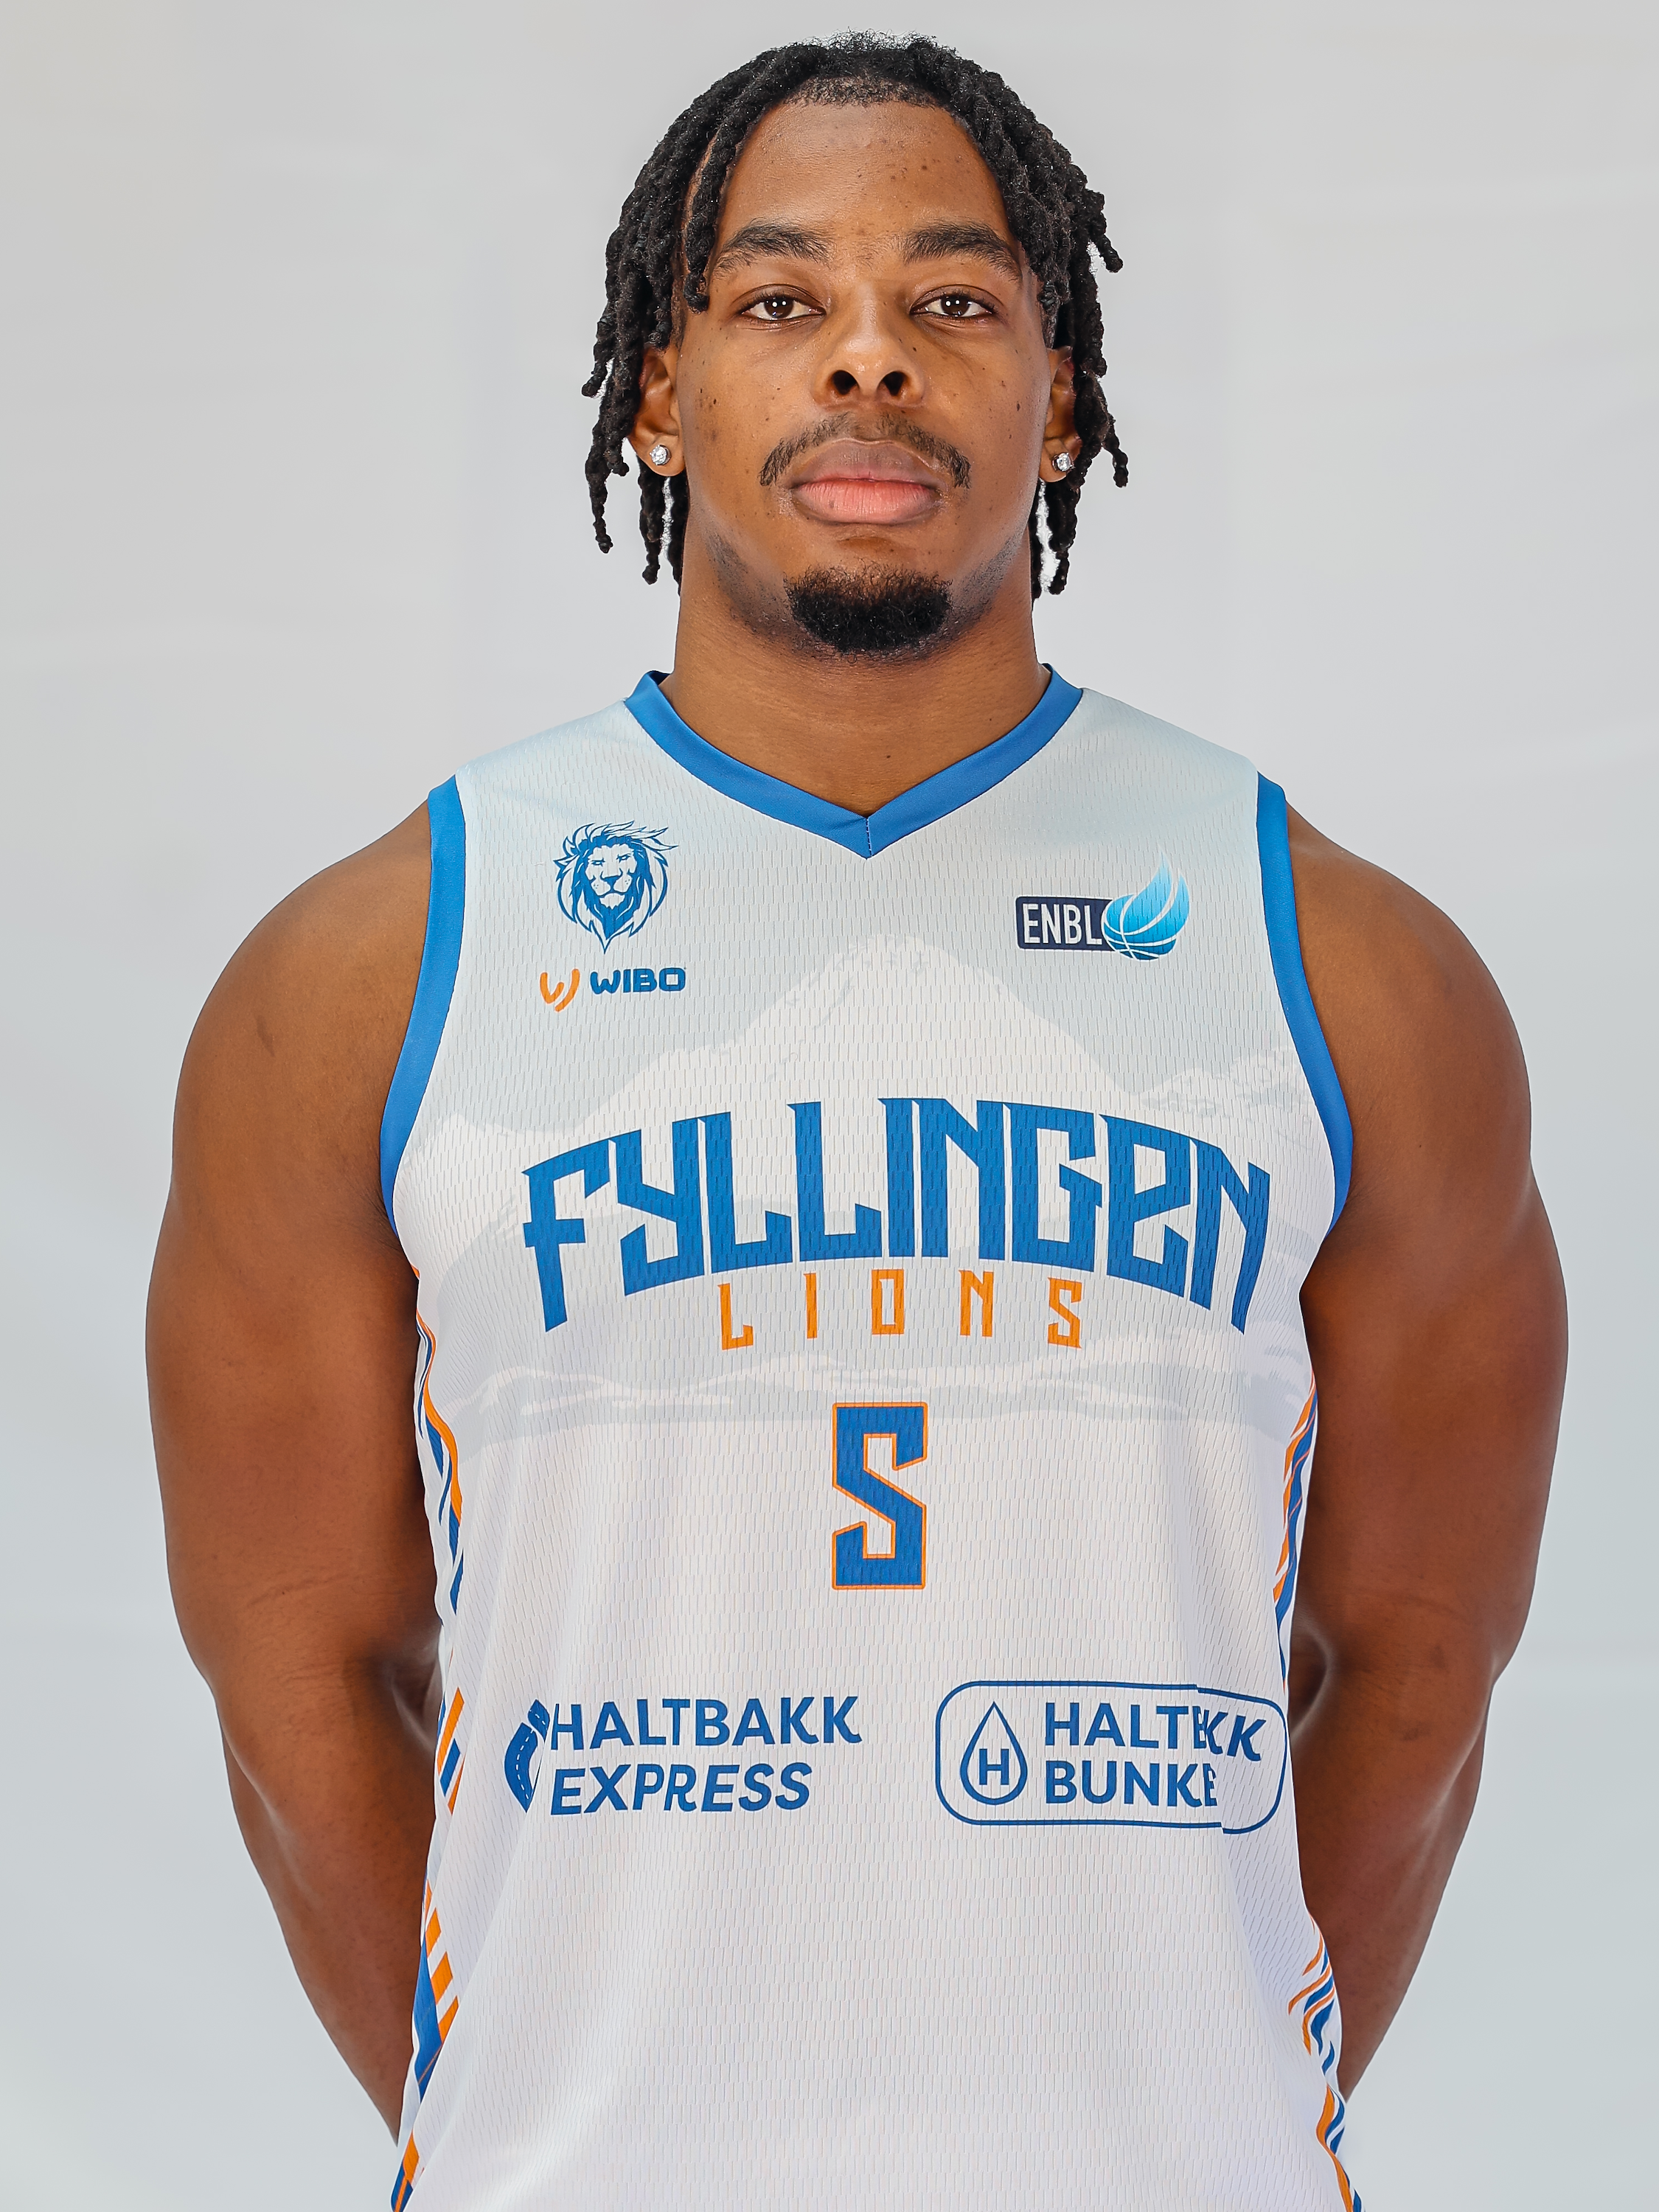 Karyiek Dixon | 6 | 15.7 | 8.7 | 1.7 | 17.5 |
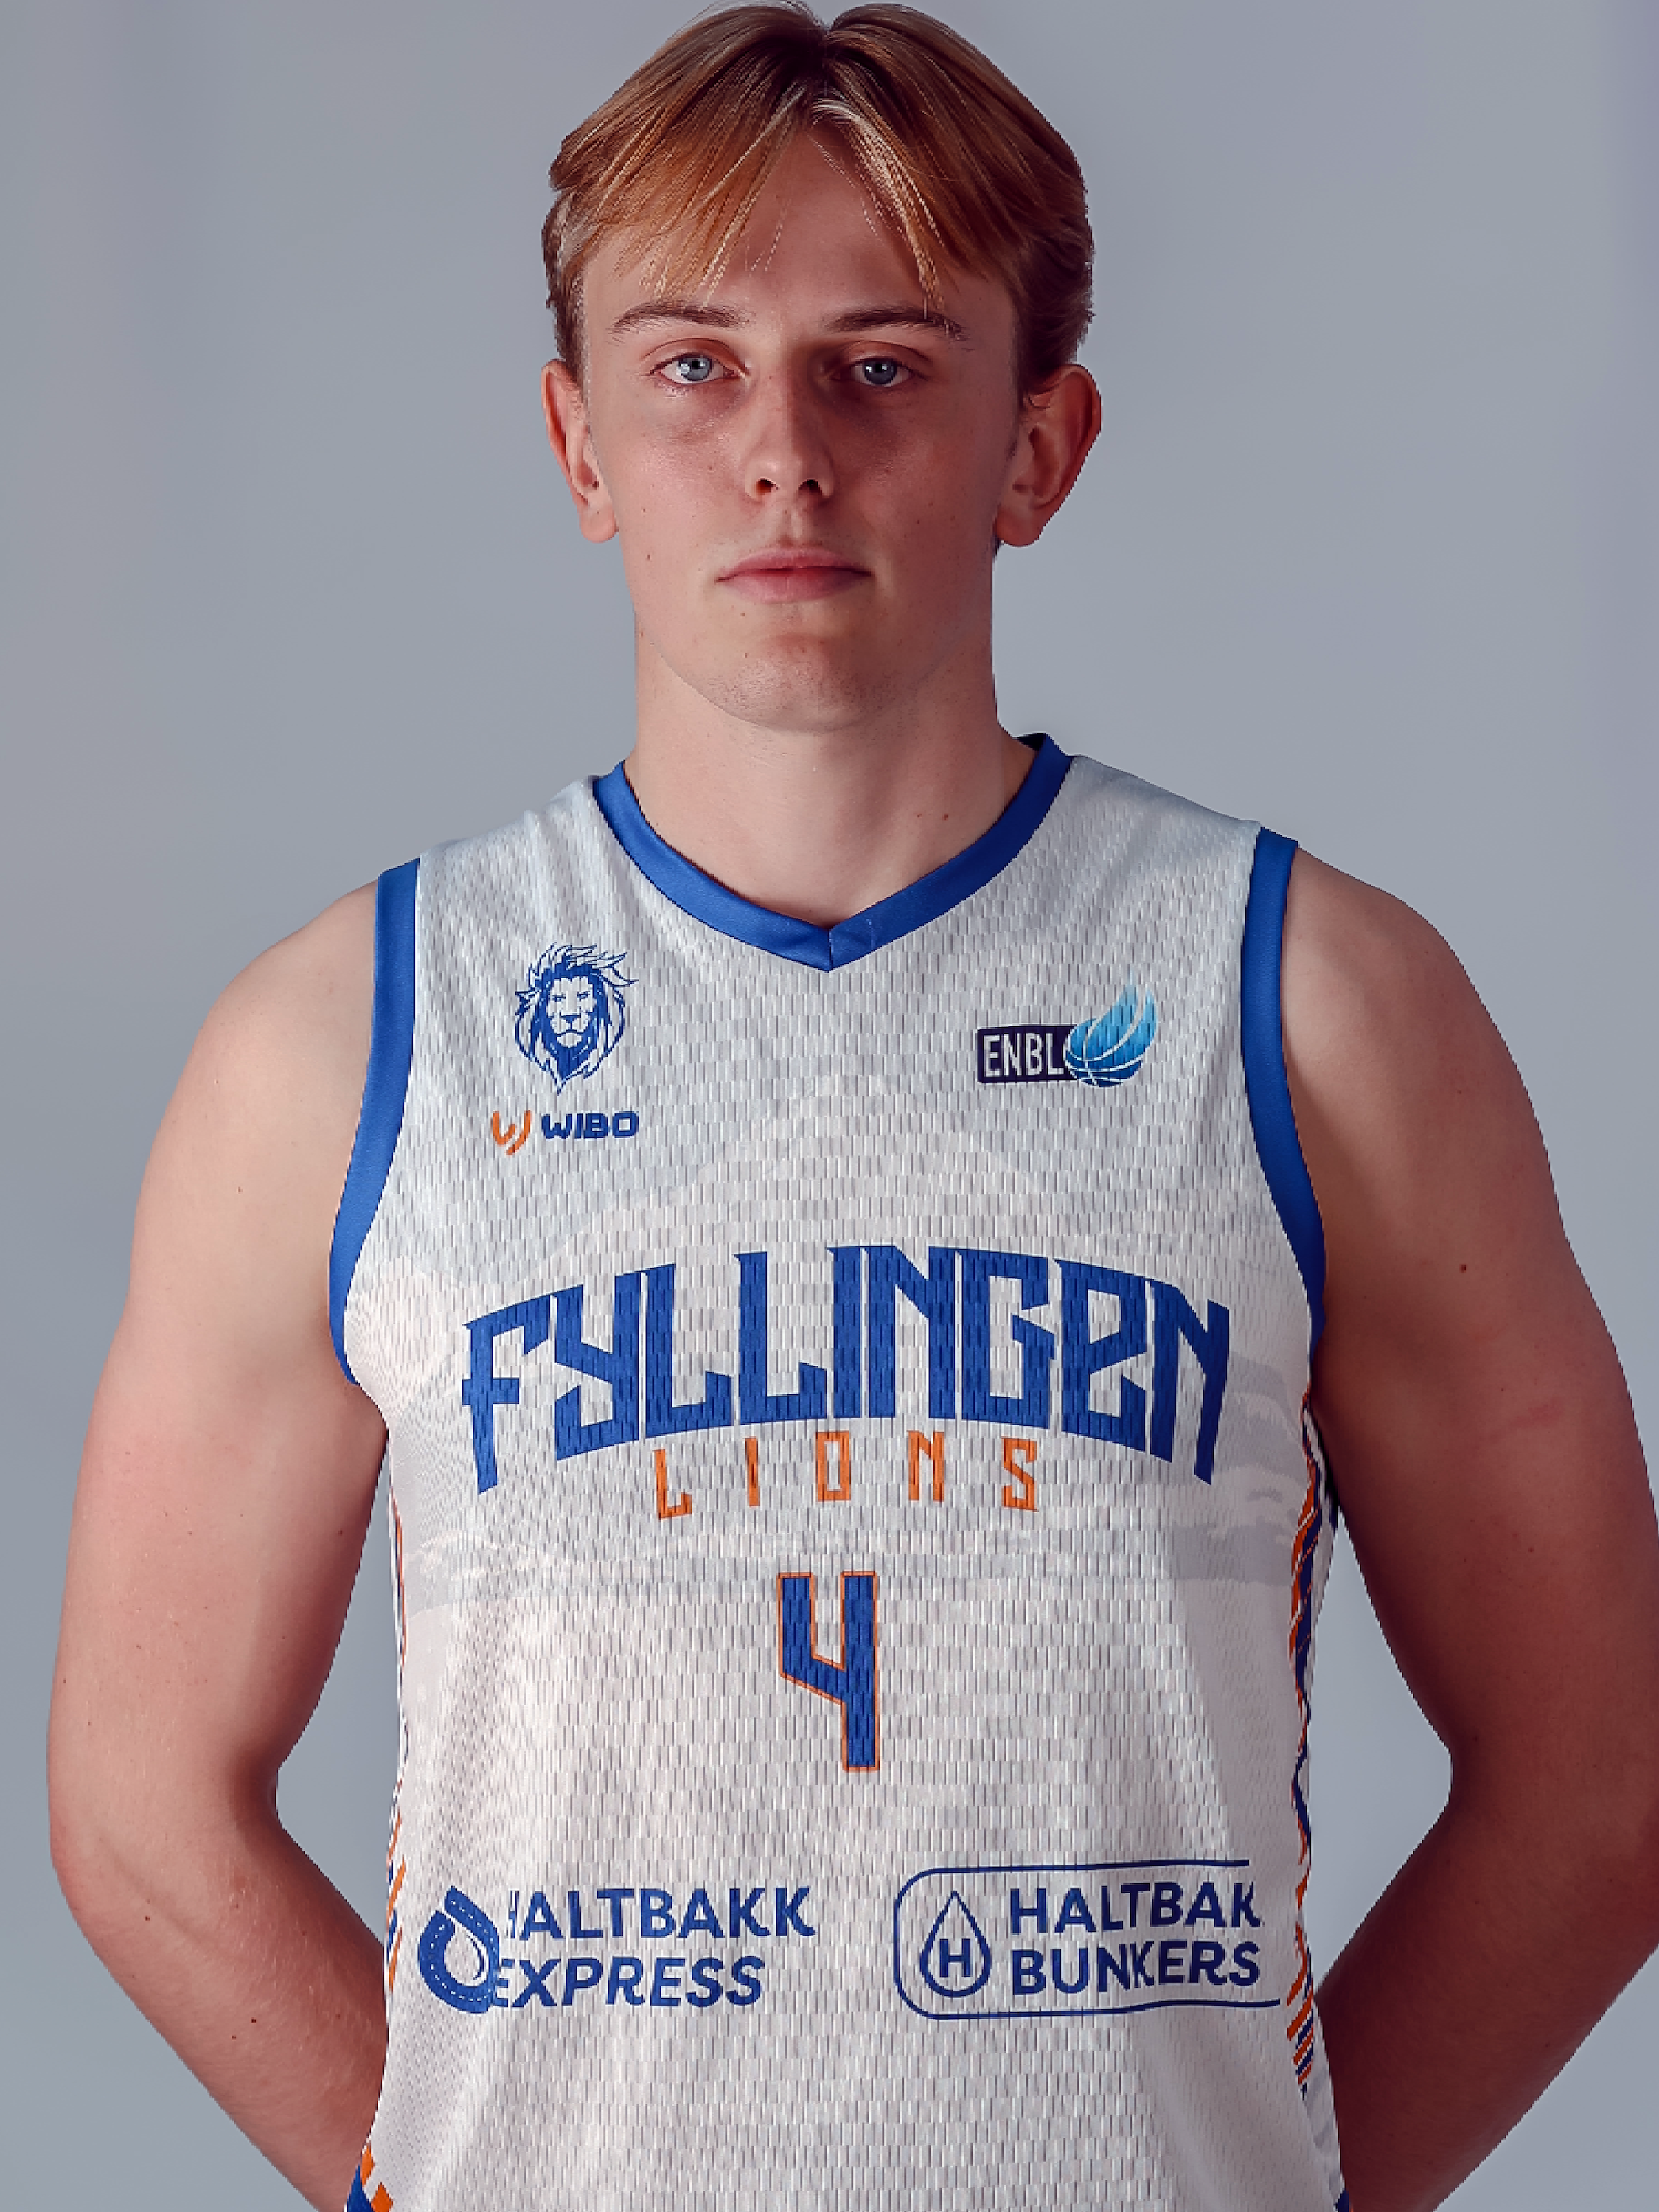 Evert Dahlberg | 4 | 8.3 | 2 | 0.8 | 8.9 |
 Sigurd Hakami Sandal | 8 | 7.4 | 3.4 | 1 | 8.4 |
 Intele Kevin Lomboto | 5 | 6 | 4.2 | 0 | 6.5 |
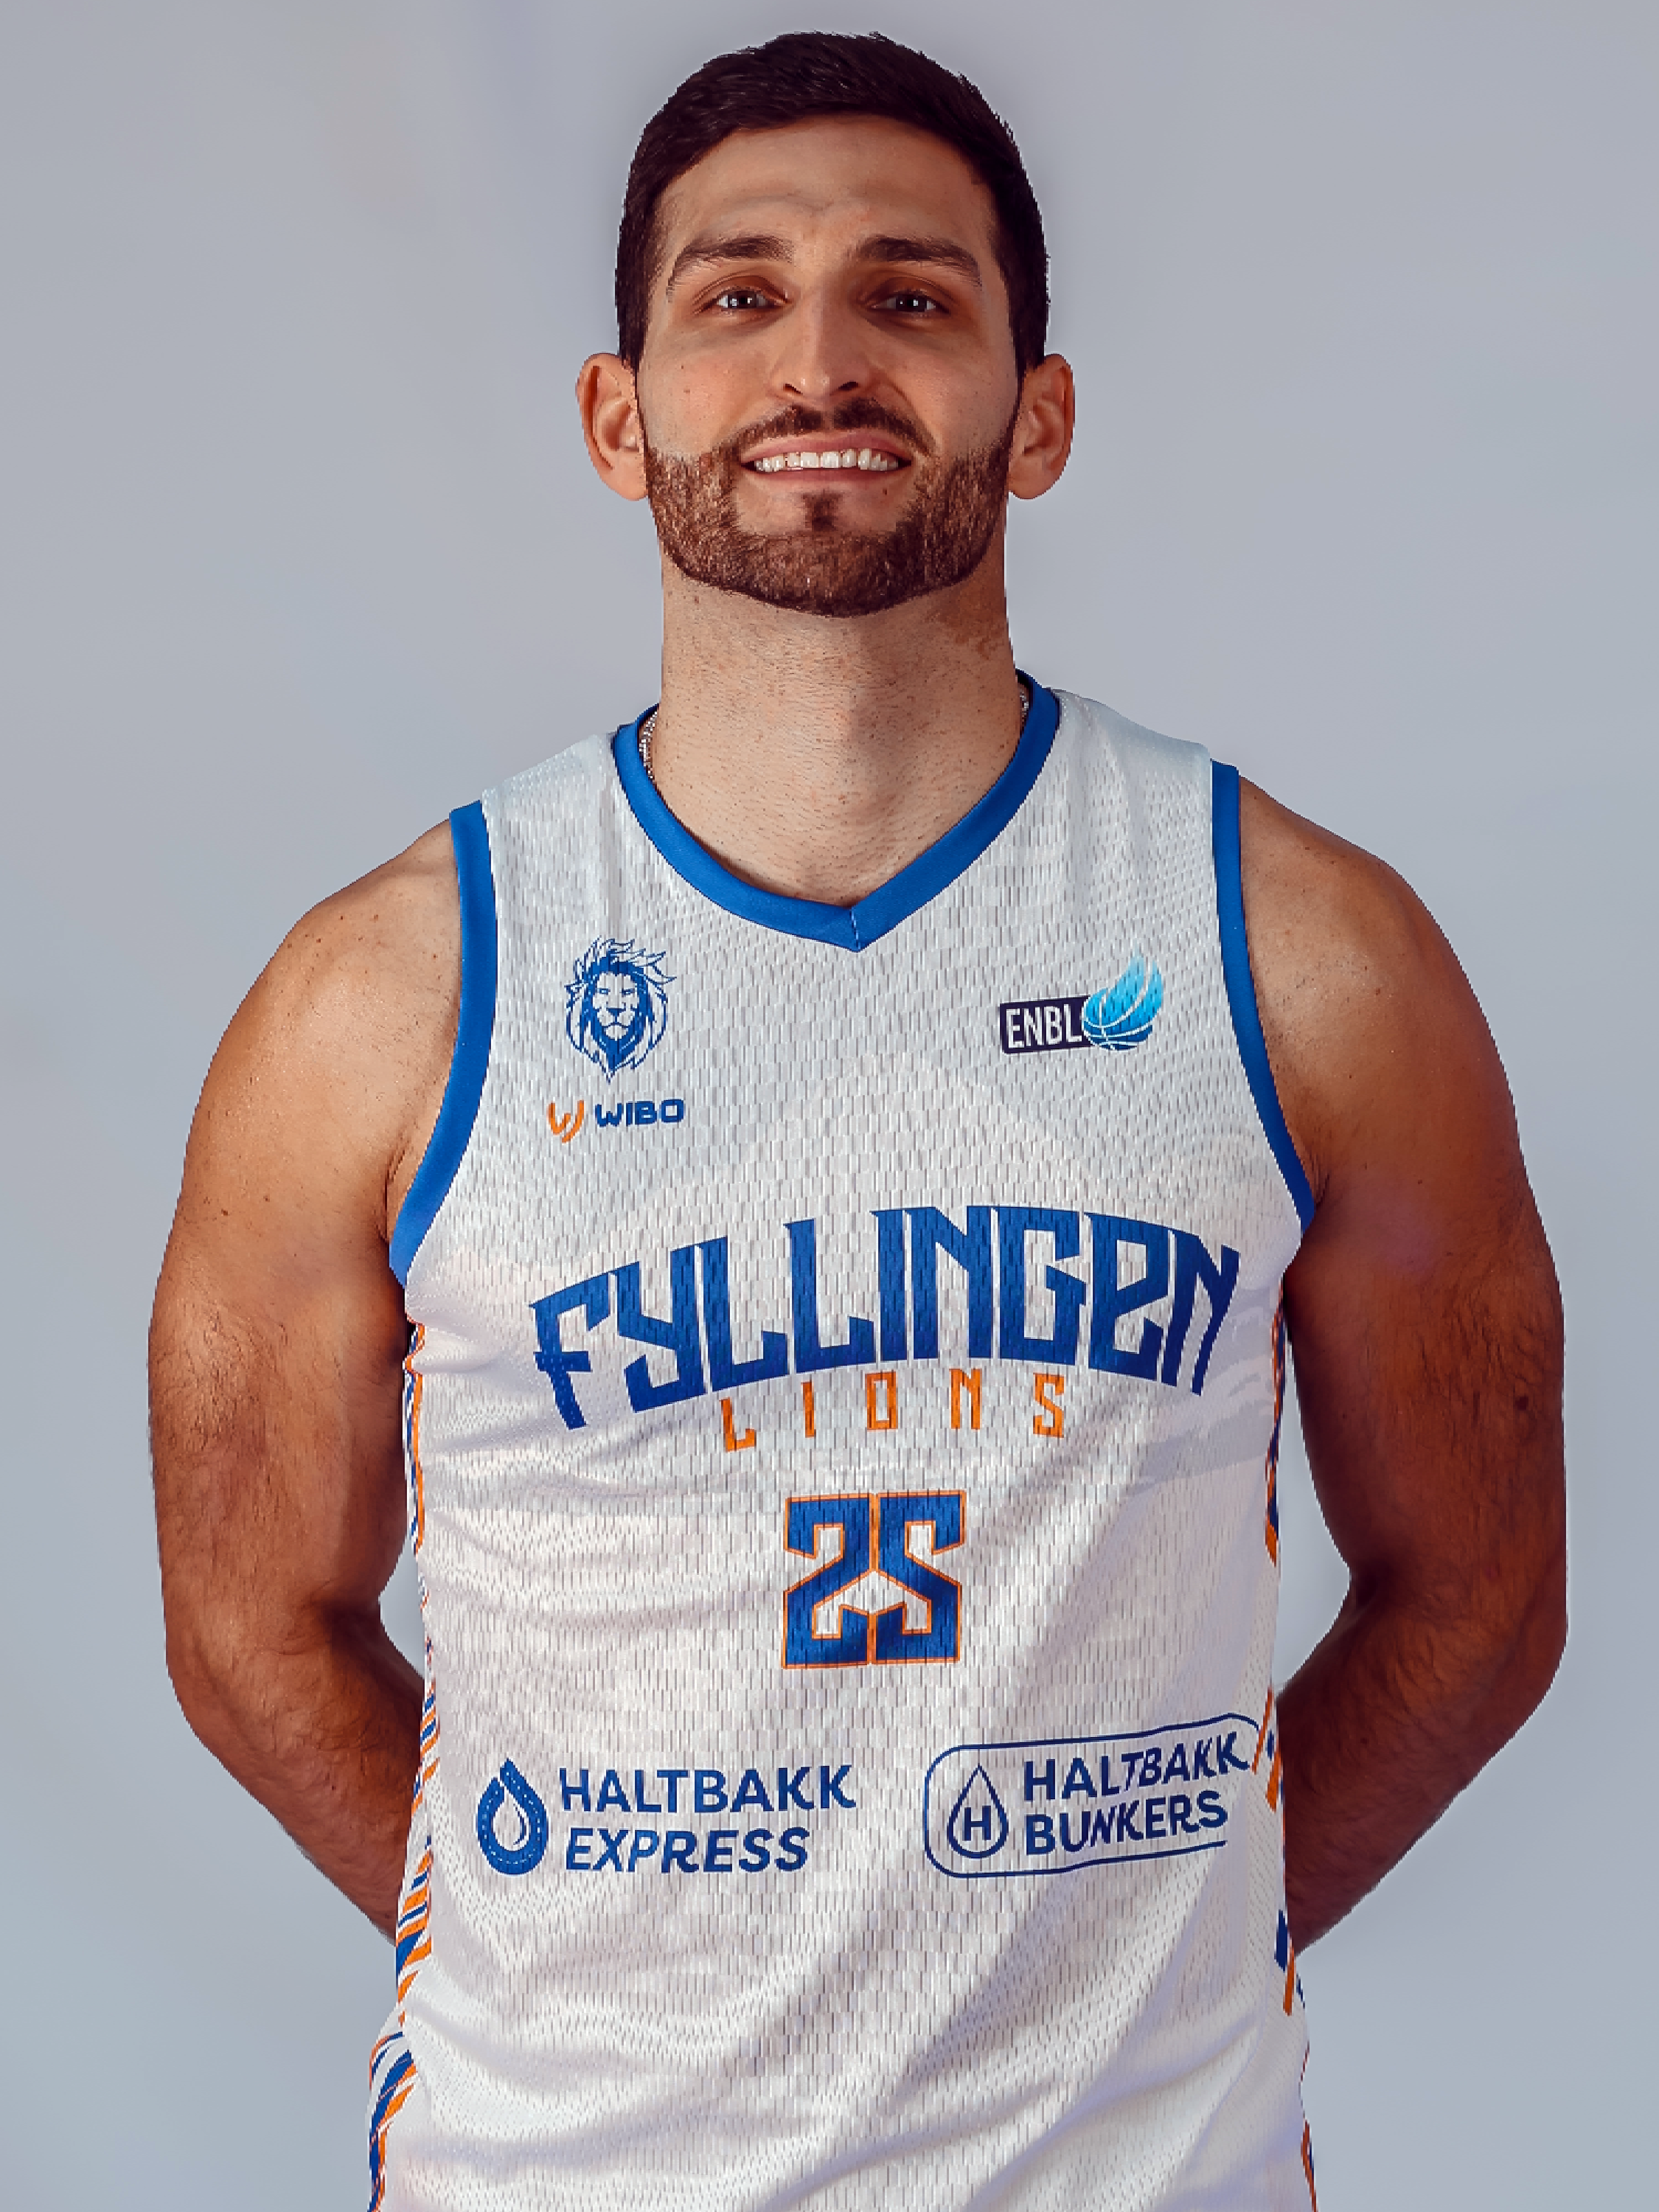 Pol Olivier Cañadell | 7 | 5.1 | 2.1 | 4 | 5.8 |
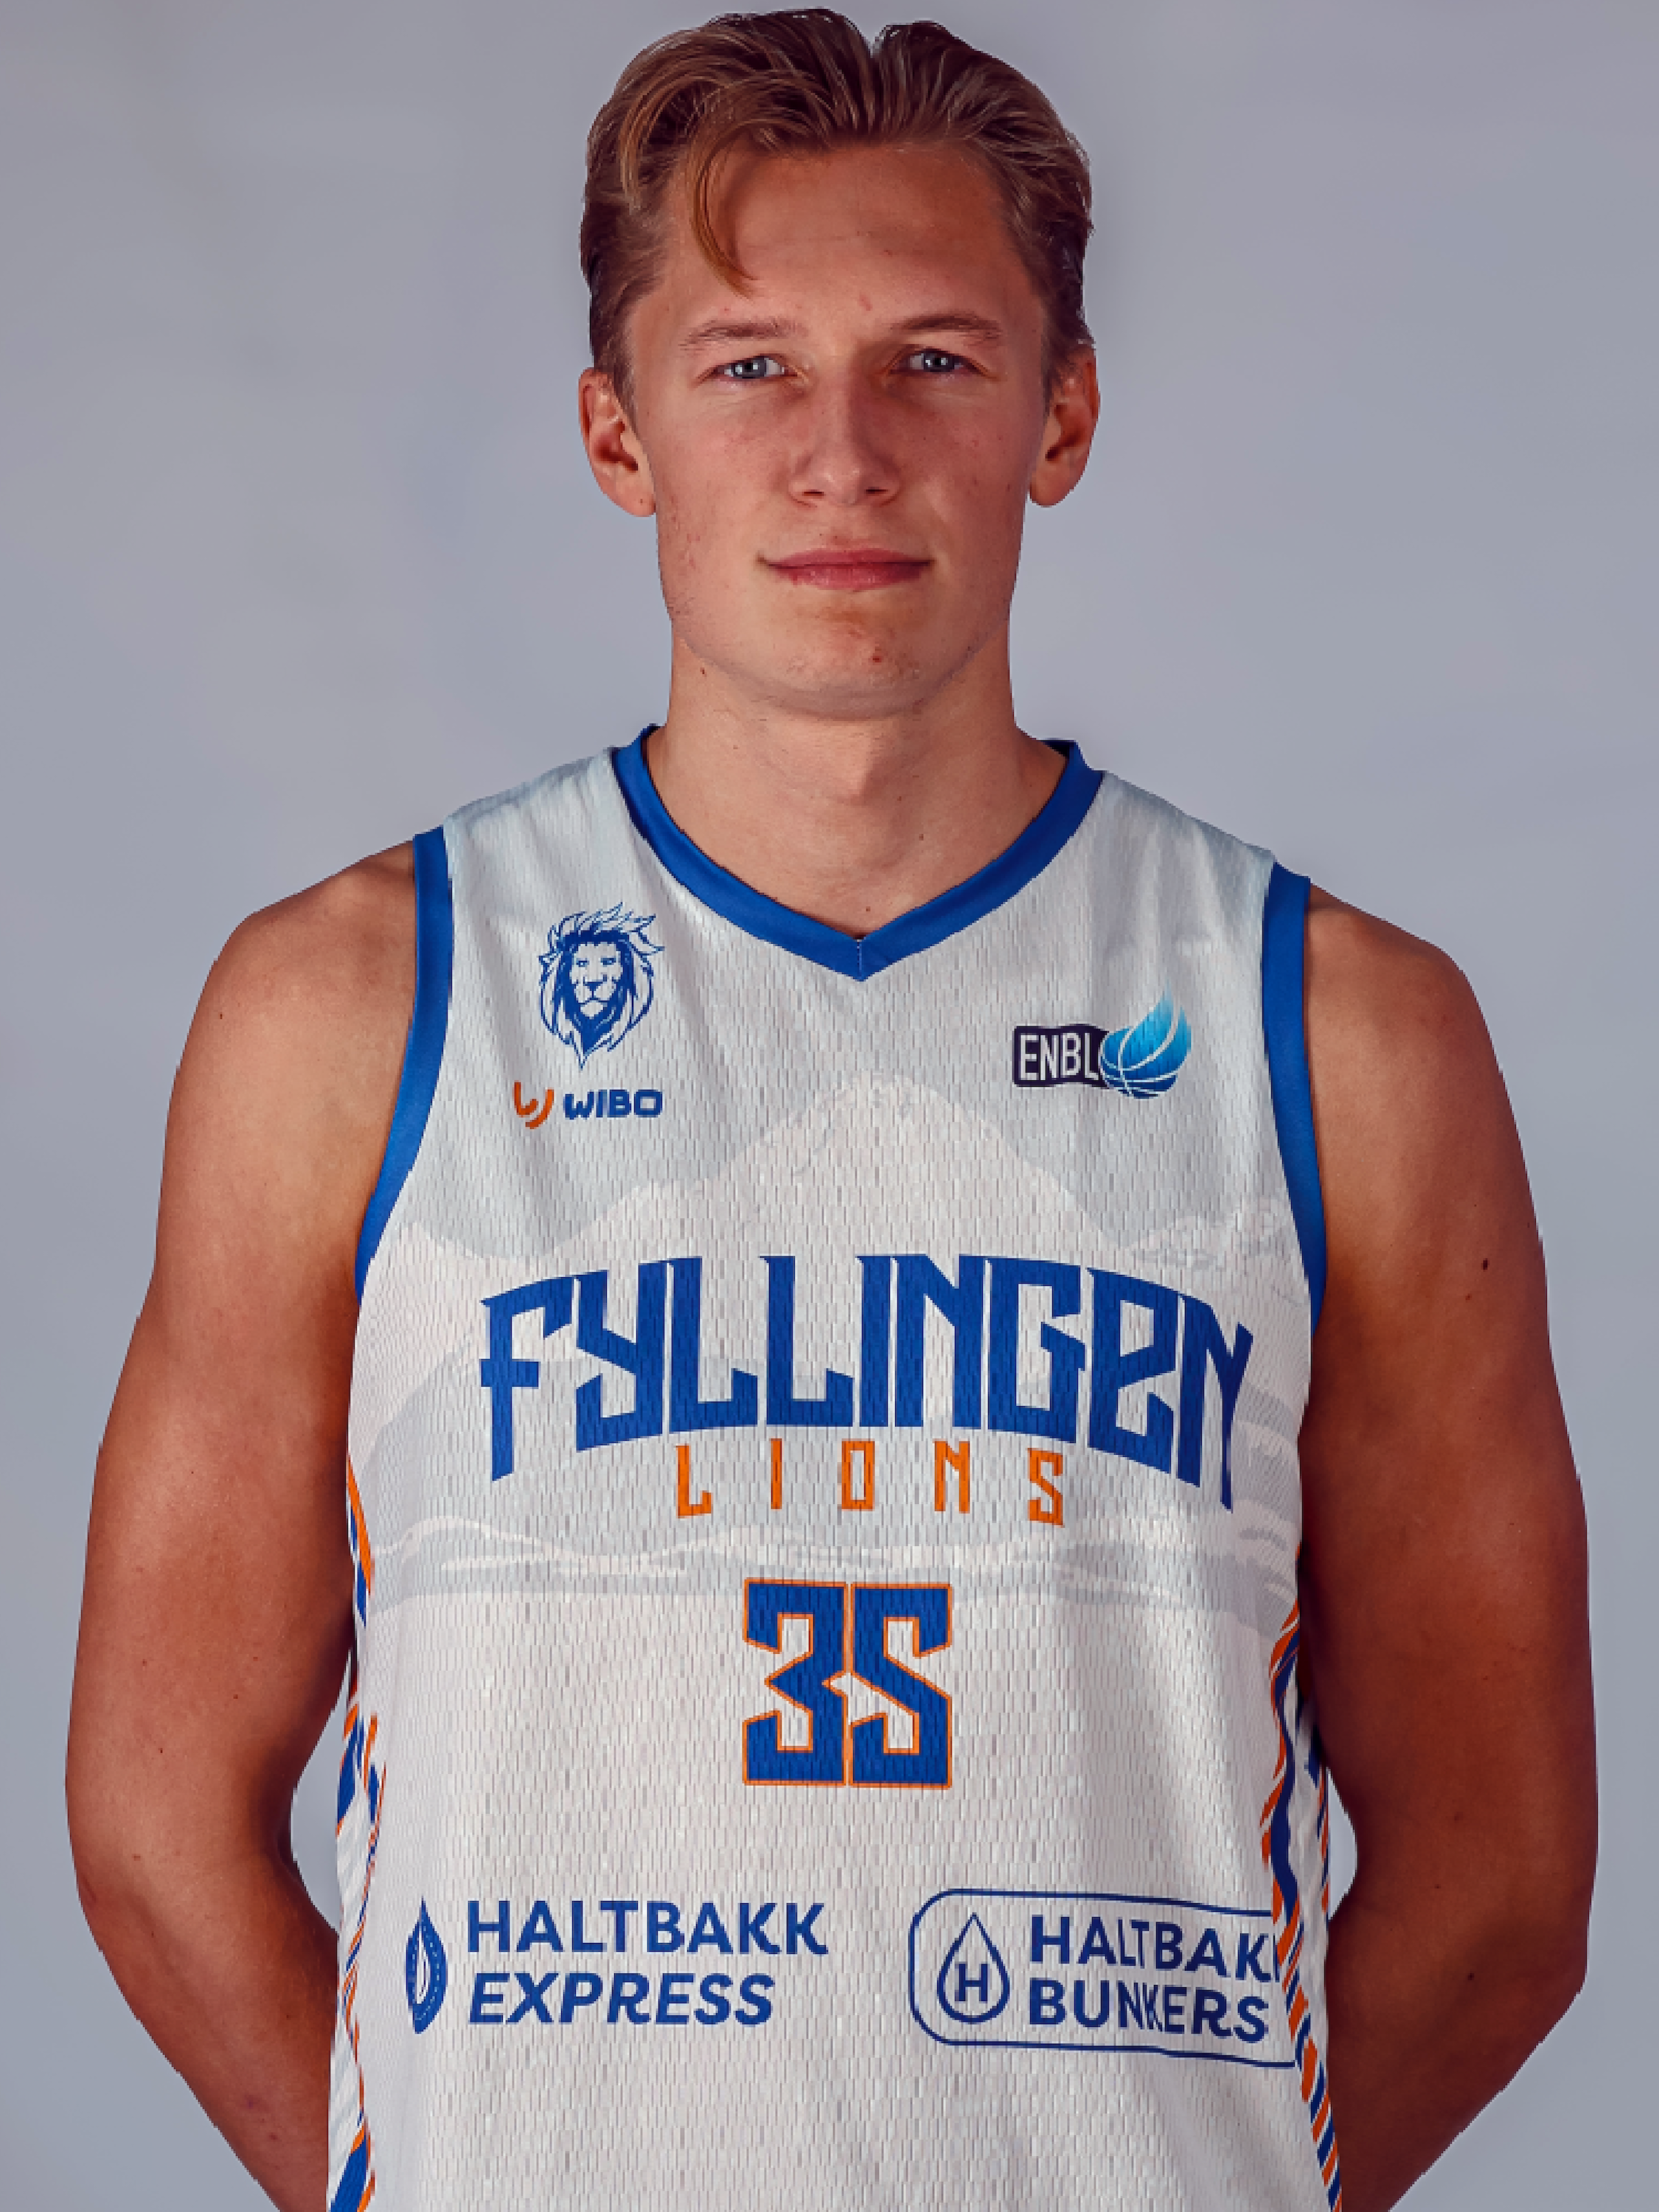 Fredrik Kleivdal | 4 | 3 | 4.3 | 2.5 | 3.6 |
 Nikolas Kvåle Skouen | 4 | 3 | 3 | 2 | 3.6 |
 Rory Leandro Kitwana Pantophlet | 5 | 1.2 | 2.2 | 0 | 1.5 |
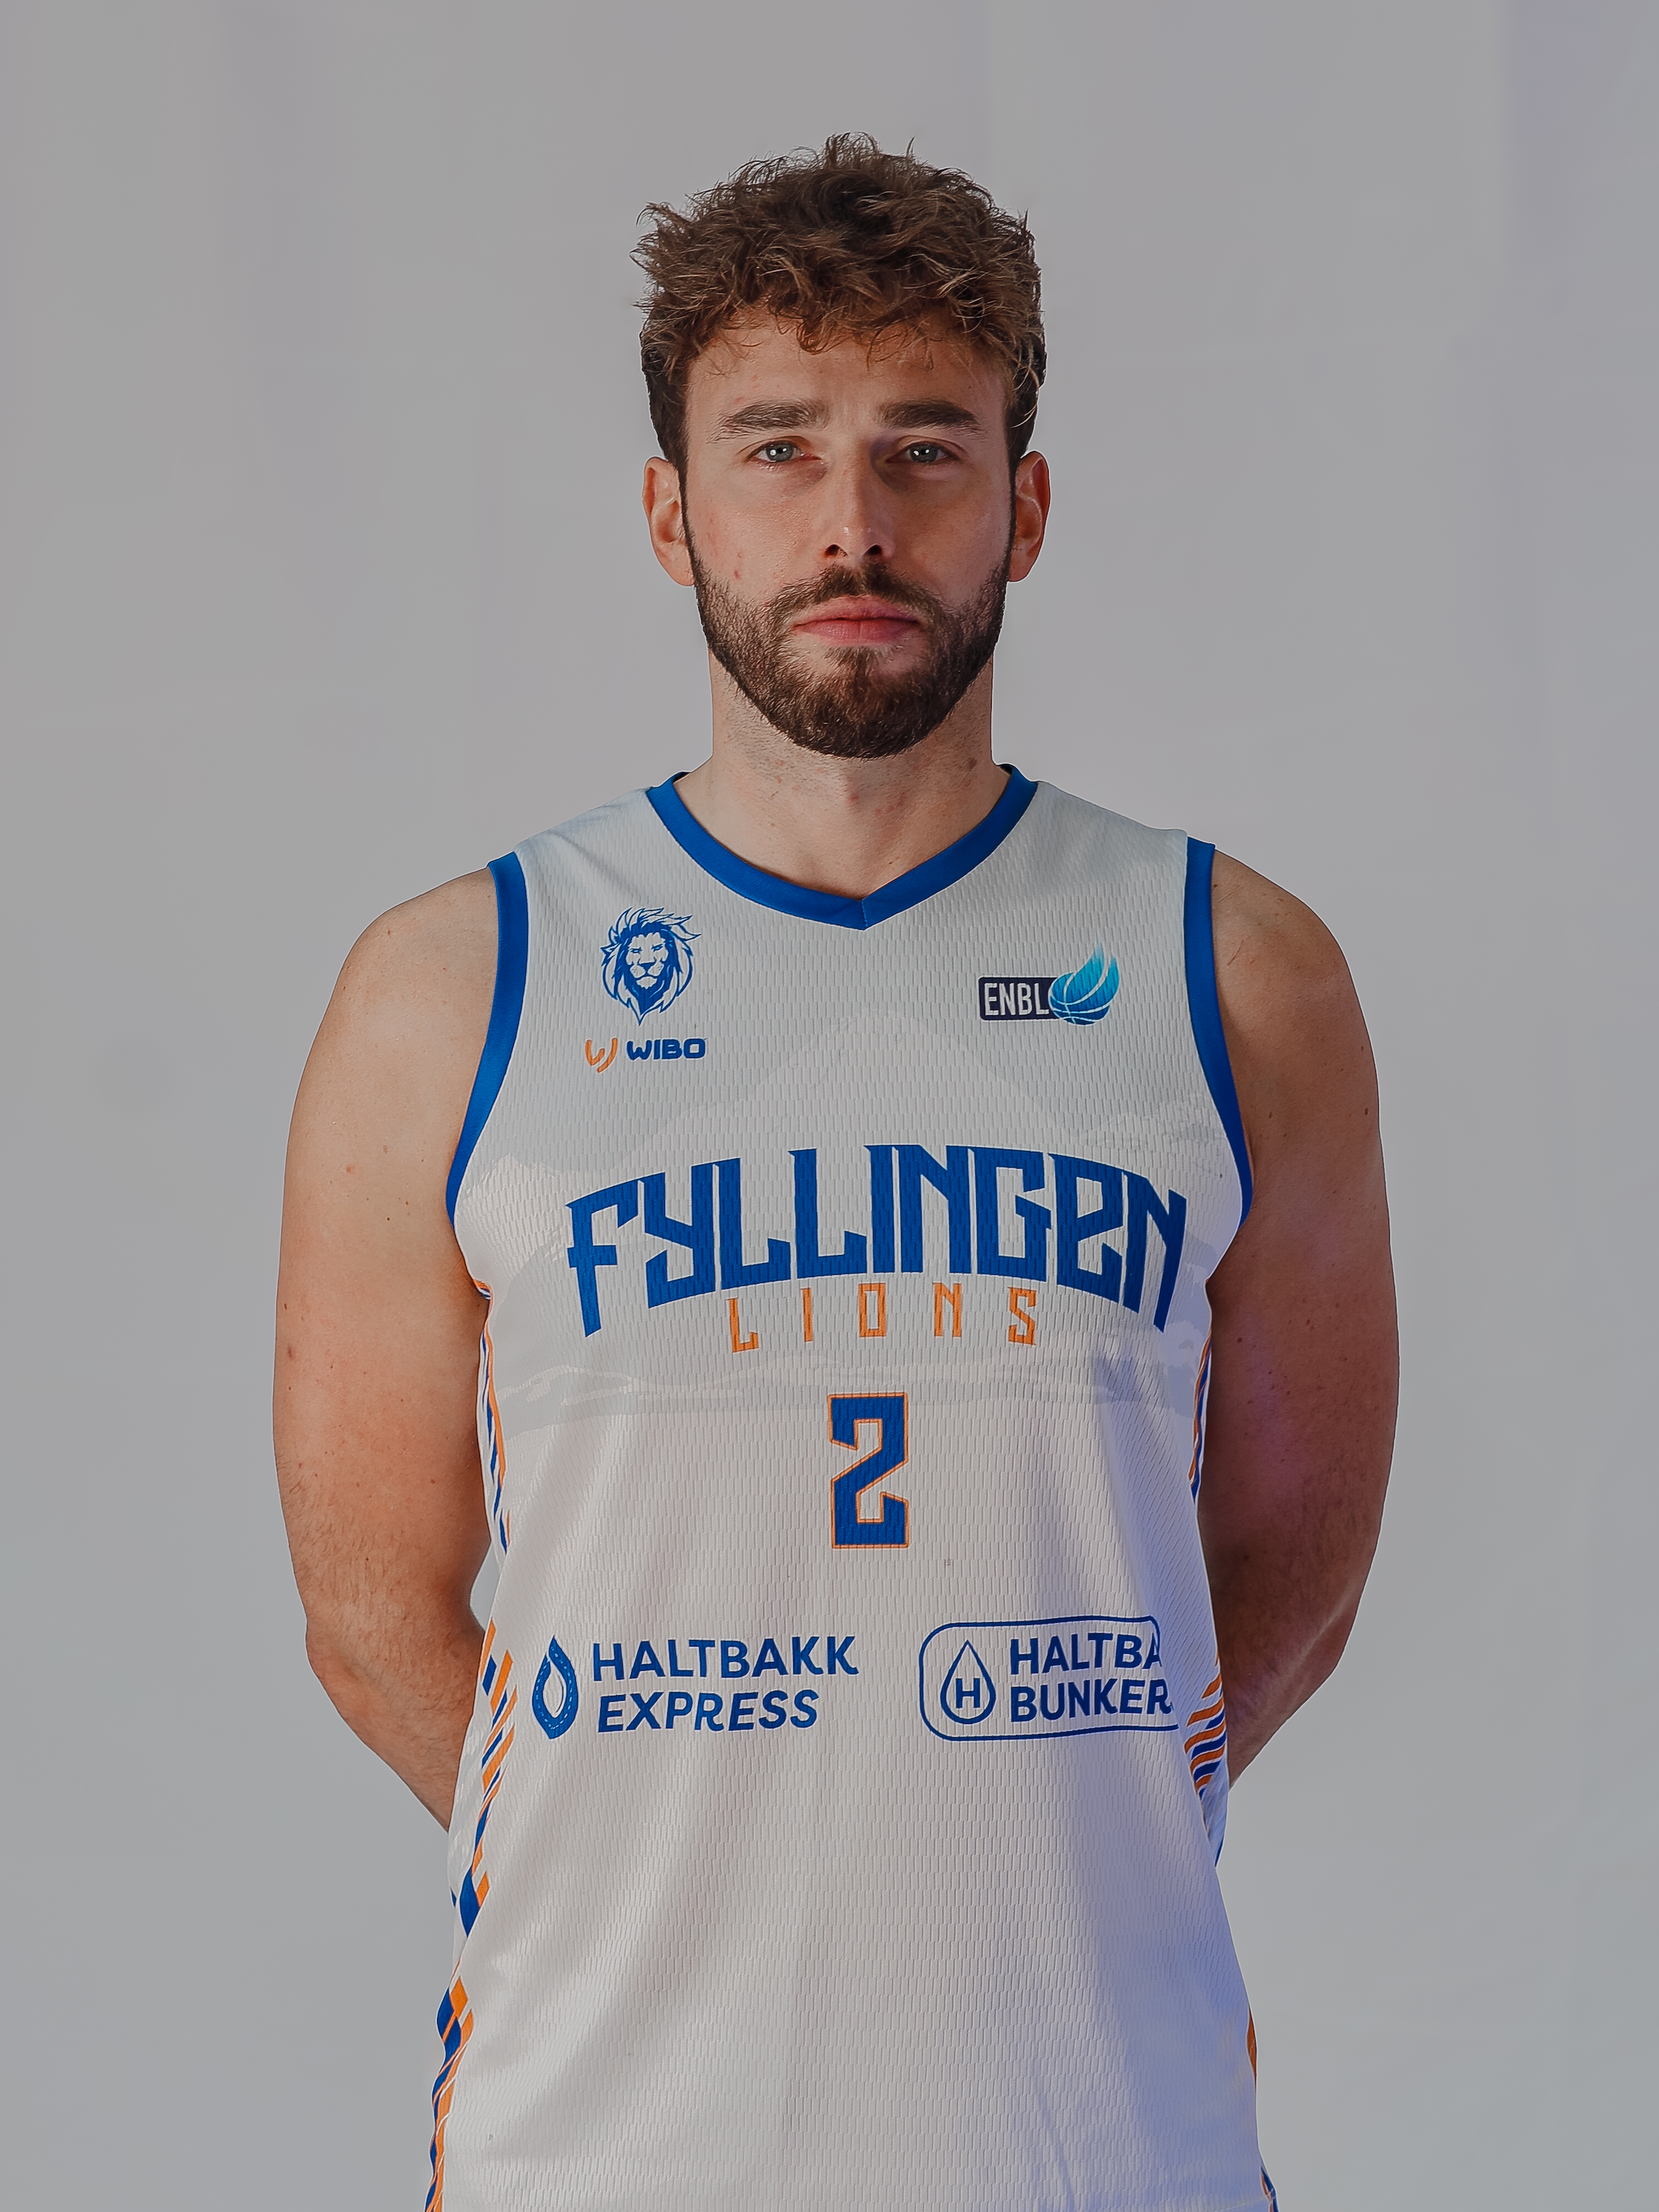 Nicolas Gundersen Ballone | 3 | 0 | 0.7 | 0 | 0 |
Advanced individual production
Season totals scaled per 100 team possessions. Click any header to order the table.
| Kalob James Ledoux | 25.5 | 4.5 | 5.5 | 2.3 | 61.3% | 58.5% | 2.43 | 6.8% | 28.8% | 23.4% | 3.5% | — |
| Lars Andreas Nilsen | 24.1 | 2.3 | 2.1 | 0.5 | 73% | 69.7% | 4.33 | 3.4% | 20.2% | 8% | 1.8% | — |
| Davonte Ray Davis | 22.3 | 7.4 | 7 | 2.1 | 57.7% | 54.4% | 3.27 | 12% | 28.7% | 32% | 3.1% | — |
| Troy Barnies | 18.4 | 7.3 | 2.1 | 1.6 | 66.5% | 66.3% | 1.36 | 11.2% | 20% | 9.4% | 2.1% | — |
| Karyiek Dixon | 17.5 | 9.7 | 1.9 | 0.9 | 63.5% | 57.1% | 2 | 16.5% | 20.5% | 7.7% | 2.4% | — |
| Evert Dahlberg | 8.9 | 2.2 | 0.8 | 1.6 | 89.1% | 93.3% | 0.5 | 6.1% | 13.8% | 4.3% | 2% | 0% |
| Sigurd Hakami Sandal | 8.4 | 3.8 | 1.1 | 1 | 52.3% | 49% | 1.14 | 8.8% | 17.4% | 6.7% | 2.8% | — |
| Intele Kevin Lomboto | 6.5 | 4.5 | 0 | 1.1 | 67.9% | 68.4% | 0 | 16.9% | 16.8% | 0% | 2.2% | 9.5% |
| Pol Olivier Cañadell | 5.8 | 2.4 | 4.5 | 0.5 | 44.8% | 41.2% | 9.33 | 6.4% | 15.2% | 26.9% | 4.4% | — |
| Fredrik Kleivdal | 3.6 | 5 | 3 | 0.6 | 26.5% | 25% | 5 | 7.8% | 10.5% | 12.9% | 1.4% | — |
| Nikolas Kvåle Skouen | 3.6 | 3.6 | 2.4 | 1.2 | 28.7% | 27.5% | 2 | 6.2% | 11.5% | 10.7% | 3.1% | 0% |
| Rory Leandro Kitwana Pantophlet | 1.5 | 2.7 | 0 | 0.5 | 60% | 60% | 0 | 16.9% | 9.7% | 0% | 3.1% | — |
| Nicolas Gundersen Ballone | 0 | 0.8 | 0 | 0 | 0% | 0% | — | 5.3% | 6.8% | 0% | 0% | — |