
Minutes and playmaking
Across both leagues, the U23 share of assists trails the U23 share of minutes. The gap is 14.3 percentage points in BLNO Men and 11.8 in BLNO Women.
NHA LAB / ROTATION RESEARCH
How BLNO clubs share playing time, finishing actions and assists between U23 players and players aged 23 and older. Explore every club and every U23 who logged minutes.
BLNO MEN + WOMEN · 2026–27
Games through 8 November 2026
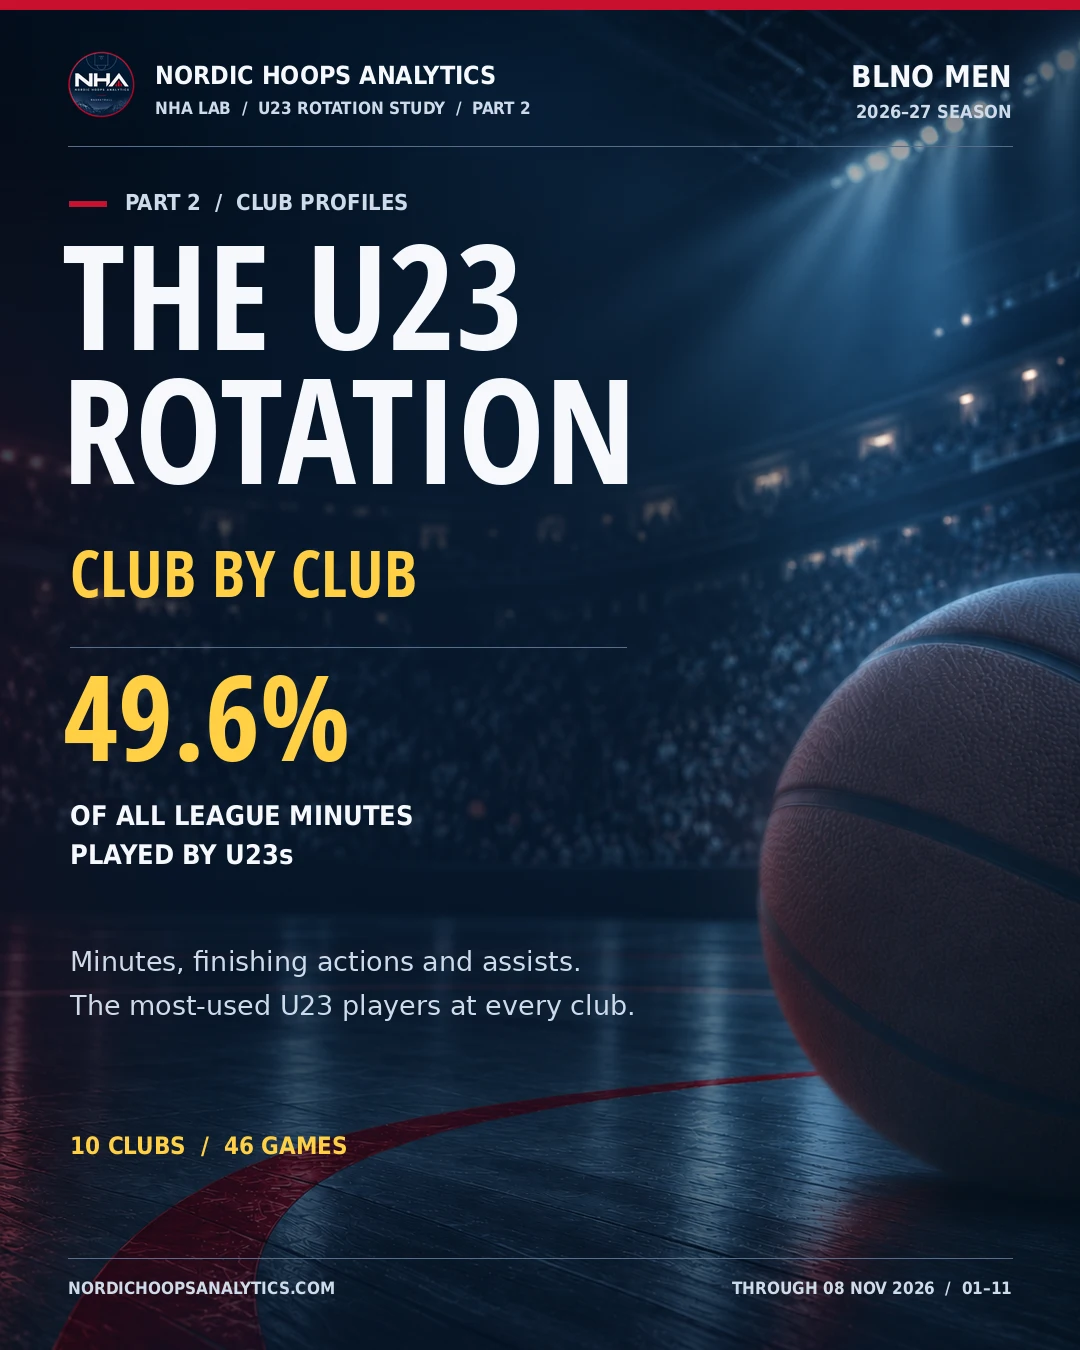 THE U23 ROTATION / PART 2 / CLUB BY CLUB
Across both leagues, the U23 share of assists trails the U23 share of minutes. The gap is 14.3 percentage points in BLNO Men and 11.8 in BLNO Women.
U23 players logged 88.7% of Nidaros’ minutes. Eleven players shared that time, and the three most-used accounted for 44.2% of the club’s U23 minutes.
Bærum used only U23 players in its four women’s games. At Asker, Valeriia Shevchenko played 32.3% of the club’s U23 minutes and recorded 63.0% of its U23 assists.
Choose a league and club. The league table compares shares of team totals. The player table shows how each club’s U23 group divides its work.
| Club | Games | Minutes | Finishing actions | Assists |
|---|---|---|---|---|
| 12 | 88.7% | 84.7% | 92.6% | |
| 7 | 82.4% | 86.5% | 76.3% | |
| 8 | 70.5% | 71.1% | 72.8% | |
| 10 | 65.2% | 58.2% | 44.3% | |
| 9 | 62.5% | 57.9% | 45.3% | |
| 10 | 32.1% | 33.4% | 16.7% | |
| 10 | 32.0% | 25.8% | 17.6% | |
| 9 | 28.1% | 14.9% | 12.7% | |
| 9 | 18.5% | 11.3% | 5.8% | |
| 8 | 10.3% | 6.1% | 7.3% | |
| League total | 46 | 49.6% | 44.7% | 35.3% |

| Age group | Minutes | Finishing actions | Assists |
|---|---|---|---|
| U23 | 2,128:00 · 88.7% | 955.44 · 84.7% | 150 · 92.6% |
| 23+ | 272:00 · 11.3% | 172.84 · 15.3% | 12 · 7.4% |
Percentage shares use the club’s U23 totals. Select a column to rank players by that measure.
| Player | |||
|---|---|---|---|
| Kevin Kwame Leraand | 383:47 · 18.0% | 215.48 · 22.6% | 20 · 13.3% |
| Oliver Edvardsen Øvermo | 281:21 · 13.2% | 160.4 · 16.8% | 21 · 14.0% |
| Rokas Lukas Pocius | 276:17 · 13.0% | 114.52 · 12.0% | 34 · 22.7% |
| Mats Bergsjordet | 253:44 · 11.9% | 150.44 · 15.7% | 37 · 24.7% |
| Tobias Edvardsen Øvermo | 243:01 · 11.4% | 70.92 · 7.4% | 10 · 6.7% |
| Gustavas Urbonas | 193:43 · 9.1% | 47.6 · 5.0% | 6 · 4.0% |
| Hallgrim Kiludidi Resheim | 152:10 · 7.2% | 44.84 · 4.7% | 11 · 7.3% |
| Dennis Valentino Tydeman Nordskag | 132:55 · 6.2% | 59.28 · 6.2% | 6 · 4.0% |
| Mikkel Thorsø | 90:57 · 4.3% | 42.64 · 4.5% | 3 · 2.0% |
| Eskil Berg Sørensen | 82:20 · 3.9% | 41.44 · 4.3% | 2 · 1.3% |
| Jakob Andreas Abelgaard | 37:45 · 1.8% | 7.88 · 0.8% | 0 · 0.0% |
Part 1 compares the leagues and their rotations. Part 2 shows the individual club profiles. Choose a league and part to browse the original slides in order.
The snapshot includes 46 BLNO Men and 17 BLNO Women regular-season games through 8 November 2026. U23 means born in 2004 or later, using age on 31 December 2026. Every team game and every player with recorded minutes is included. The league totals pool player counts across games.
Finishing actions are estimated as field-goal attempts + 0.44 × free-throw attempts + turnovers. Assists are the official box-score totals. The age-group shares divide by the full team total. Each U23 player’s shares divide by the club’s U23 total for that measure. The finishing estimate describes offensive responsibility over the whole game.
Player points reconcile with the official scores in all 63 games. Minutes are used as recorded, including the six team records with a difference of more than 60 seconds from the expected total. Clubs played different numbers of games, so read each percentage with its sample size. Shares describe recorded usage and creation. Film is needed to assess the role or quality of individual actions.