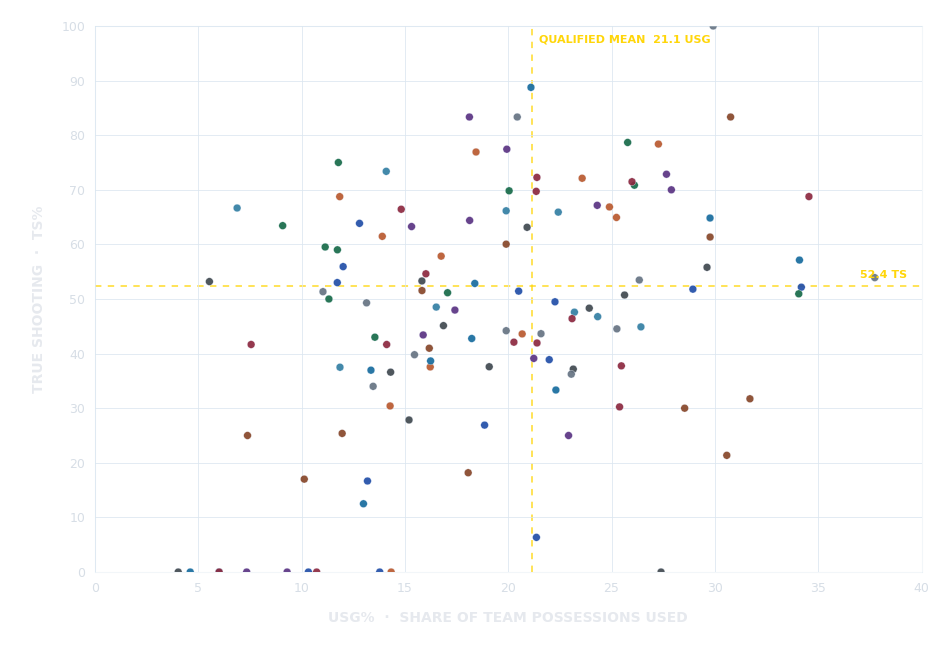
A player’s scoring profile becomes more useful when we read efficiency alongside offensive responsibility. This map compares estimated usage with true shooting and flags profiles for closer analysis.
2026–27 season · Player data through 4 October 2026
122players with calculable rates
75players in the reference sample
21.1% / 52.4%qualified-player mean · USG / TS%
The league-wide map
Each point is a player. The dashed lines mark the qualified sample means. Team colours identify the player’s club on the full-league view.
The strongest conversion rates appear both among players with substantial usage and players carrying a smaller role. These are different offensive profiles: the first group combines volume and conversion, while the second shows efficient finishing so far without proving how those rates would respond to more self-created possessions.
Several high-usage players sit close to the efficiency reference. Hadley’s TS% is just 1.4 percentage points below the qualified mean despite a 34.1% usage rate. That is a near-mean result on a large workload; the more pronounced gaps around 45% TS deserve a closer look at shot mix and creation context.
Early-season rates describe current output. They do not measure defensive impact, passing value or the difficulty of each shot.
High role · high TS%
18 qualified players
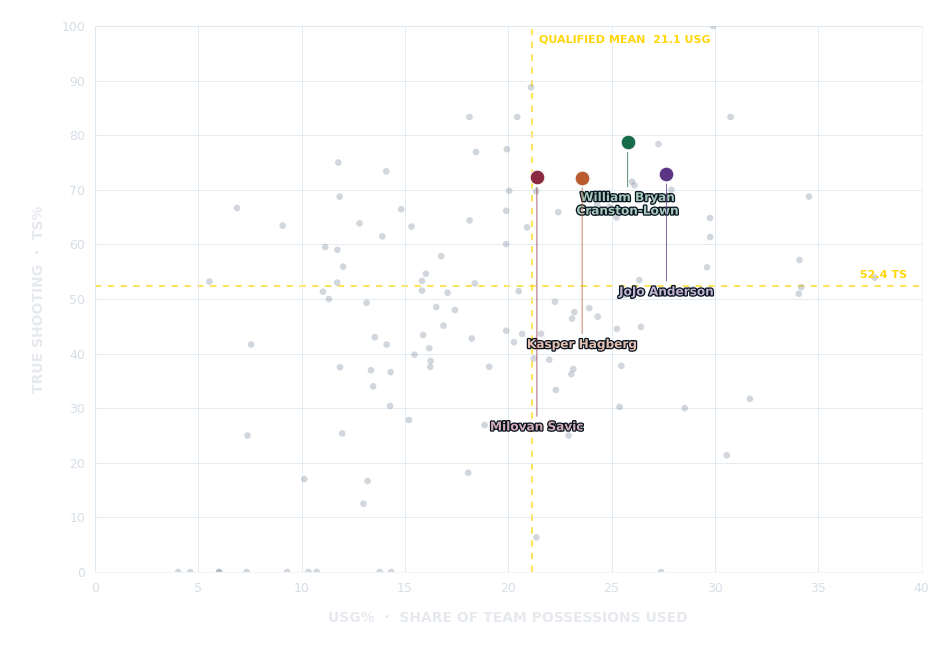
These players combine above-mean usage with above-mean true shooting. Cranston-Lown (25.8% USG, 78.7% TS) and Anderson (27.7%, 72.9%) lead the clearest multi-game signals. Hagberg and Savic add three-game support. Downs’ 78.4% TS on 27.3% USG is striking, but it comes from two games and needs more evidence.
Selected players are labelled. Dashed lines show the qualified-player means.
Players above both references
On mobile: scroll the table horizontally to see every column.
High role · high TS%
Player
Team
GP
USG%
TS%
William Bryan Cranston-Lown
Ammerud BLNO
3
25.8%
78.7%
Drake Downs
Frøya
2
27.3%
78.4%
JoJo Anderson
Kongsberg Miners
4
27.7%
72.9%
Milovan Savic
Gimle
3
21.4%
72.3%
Kasper Hagberg
Frøya
3
23.6%
72.1%
Mikkel Bedason Kolstad
Gimle
2
26.0%
71.5%
Oleksander Horiuk
Ammerud BLNO
3
26.1%
70.8%
Lars Fredrik Mensah Espe
Gimle
2
21.4%
69.7%
Justin William Mullins
Gimle
2
34.6%
68.8%
Joe Cookson
Kongsberg Miners
4
24.3%
67.2%
Jacob Månsson
Frøya
3
24.9%
66.9%
Stian Mjøs
Bærum Basket
4
22.4%
65.9%
Cory Johnson
Frøya
3
25.2%
64.9%
Kalob James Ledoux
Fyllingen
2
29.8%
64.8%
Johannes Dolven
Centrum Tigers
2
29.8%
61.3%
Davonte Ray Davis
Fyllingen
2
34.1%
57.1%
Filip August Klemmetsby
TNT Towers
4
29.6%
55.8%
Pietro Mortarino
Nidaros Jets
3
37.7%
53.9%
Lower role · high TS%
17 qualified players
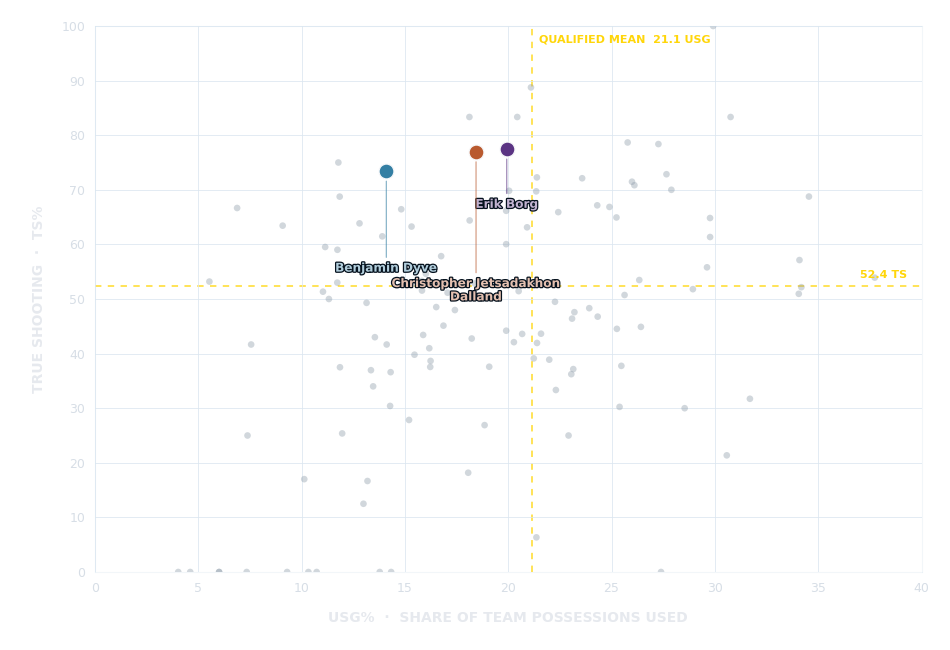
Borg (19.9% USG, 77.4% TS) and Dalland (18.4%, 76.9%) pair excellent conversion with moderate usage. Dyve and Jacobsen also stand out. The data supports an efficient current role; it cannot establish whether conversion would hold if their creation burden increased.
Selected players are labelled. A high TS% at lower usage is evidence of current conversion, not a projection at a larger role.
Players above the TS% mean and below the USG mean
On mobile: scroll the table horizontally to see every column.
Lower role · high TS%
Player
Team
GP
USG%
TS%
Erik Borg
Kongsberg Miners
4
19.9%
77.4%
Christopher Jetsadakhon Dalland
Frøya
3
18.4%
76.9%
Benjamin Dyve
Bærum Basket
4
14.1%
73.4%
Henrik Male Davidsen
Ammerud BLNO
3
20.0%
69.8%
Sondre Jacobsen
Frøya
3
11.8%
68.8%
Filip Rypdal Øverås
Bærum Basket
4
19.9%
66.2%
Joshua Ipalibo Hart
Kongsberg Miners
4
18.1%
64.4%
Anders Isaksen Solem
Tromsø Storm
4
12.8%
63.9%
Mio Mandt
Ammerud BLNO
3
9.1%
63.4%
Brage Vejlgaard Sørensen
Kongsberg Miners
4
15.3%
63.3%
Per Ingar Berthelsen
TNT Towers
3
20.9%
63.1%
Malik Abdul Rauf
Centrum Tigers
2
19.9%
60.0%
Aksel Hvalgård Borg
Frøya
3
16.8%
57.8%
David Berntsen
Tromsø Storm
4
12.0%
55.9%
Jørgen Andreas Lamo
Gimle
4
16.0%
54.6%
Vladyslav Unhurian
TNT Towers
3
15.8%
53.3%
Troy Barnies
Fyllingen
2
18.4%
52.8%
High role · below-mean TS%
18 qualified players
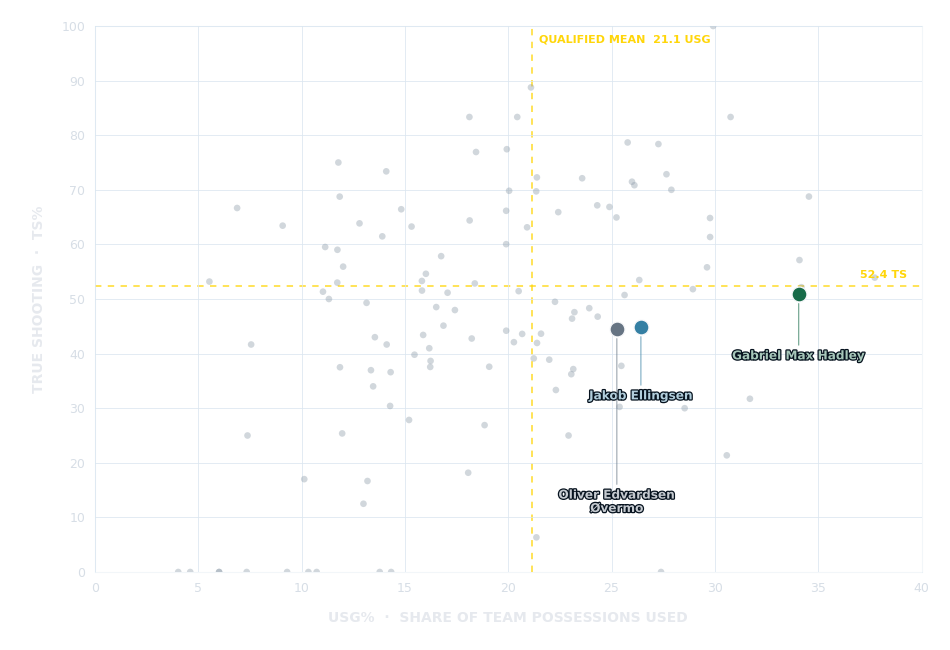
Hadley carries 34.1% usage, with 51.0% TS across 67 field-goal attempts. The 1.4-point gap to the qualified mean is modest. Ellingsen (44.9%) and Øvermo (44.5%) show a wider conversion gap over four games each. Shot mix and creation load are the next questions, not a verdict on player quality.
Selected players are labelled. Distances from the mean should be read alongside sample size and role.
Players above the USG mean and below the TS% mean
On mobile: scroll the table horizontally to see every column.
High role · below-mean TS%
Player
Team
GP
USG%
TS%
Garrett Daniel Denbow
Tromsø Storm
2
34.2%
52.2%
Gabriel Max Hadley
Ammerud BLNO
3
34.1%
51.0%
Morten Midtlie Holsæter
Centrum Tigers
2
30.6%
21.4%
Johannes Rydningen Lange
Tromsø Storm
4
28.9%
51.8%
Jakob Ellingsen
Bærum Basket
4
26.4%
44.9%
Jan Prus
TNT Towers
2
25.6%
50.7%
Jørgen Odfjell
Gimle
2
25.5%
37.8%
Isak Smørholm Ulveseth
Gimle
2
25.4%
30.2%
Oliver Edvardsen Øvermo
Nidaros Jets
4
25.3%
44.5%
Pau Tendero Salom
Bærum Basket
2
24.3%
46.8%
Sindre Steinhaug Christoffersen
TNT Towers
4
23.9%
48.3%
Dante Olsen
Bærum Basket
4
23.2%
47.6%
Shamel Ibrahim Shaka
TNT Towers
4
23.1%
37.2%
Jovan Radulovic
Gimle
4
23.1%
46.4%
Grant Sitton
Tromsø Storm
2
22.3%
49.5%
Dennis Valentino Tydeman Nordskag
Nidaros Jets
3
21.6%
43.6%
Aksel Svenkerud-Raundalen
Gimle
2
21.4%
41.9%
Donnie Tillman
Kongsberg Miners
4
21.2%
39.1%
Qualified player data
All 75 players in the reference sample, sorted by USG%. Use the club-colour marker to scan the table by team.
All 75 qualified players
On mobile: scroll the table horizontally to see every column.
Qualified player data
Player
Team
GP
USG%
TS%
Pietro Mortarino
Nidaros Jets
3
37.7%
53.9%
Justin William Mullins
Gimle
2
34.6%
68.8%
Garrett Daniel Denbow
Tromsø Storm
2
34.2%
52.2%
Davonte Ray Davis
Fyllingen
2
34.1%
57.1%
Gabriel Max Hadley
Ammerud BLNO
3
34.1%
51.0%
Morten Midtlie Holsæter
Centrum Tigers
2
30.6%
21.4%
Johannes Dolven
Centrum Tigers
2
29.8%
61.3%
Kalob James Ledoux
Fyllingen
2
29.8%
64.8%
Filip August Klemmetsby
TNT Towers
4
29.6%
55.8%
Johannes Rydningen Lange
Tromsø Storm
4
28.9%
51.8%
JoJo Anderson
Kongsberg Miners
4
27.7%
72.9%
Drake Downs
Frøya
2
27.3%
78.4%
Jakob Ellingsen
Bærum Basket
4
26.4%
44.9%
Oleksander Horiuk
Ammerud BLNO
3
26.1%
70.8%
Mikkel Bedason Kolstad
Gimle
2
26.0%
71.5%
William Bryan Cranston-Lown
Ammerud BLNO
3
25.8%
78.7%
Jan Prus
TNT Towers
2
25.6%
50.7%
Jørgen Odfjell
Gimle
2
25.5%
37.8%
Isak Smørholm Ulveseth
Gimle
2
25.4%
30.2%
Oliver Edvardsen Øvermo
Nidaros Jets
4
25.3%
44.5%
Cory Johnson
Frøya
3
25.2%
64.9%
Jacob Månsson
Frøya
3
24.9%
66.9%
Pau Tendero Salom
Bærum Basket
2
24.3%
46.8%
Joe Cookson
Kongsberg Miners
4
24.3%
67.2%
Sindre Steinhaug Christoffersen
TNT Towers
4
23.9%
48.3%
Kasper Hagberg
Frøya
3
23.6%
72.1%
Dante Olsen
Bærum Basket
4
23.2%
47.6%
Shamel Ibrahim Shaka
TNT Towers
4
23.1%
37.2%
Jovan Radulovic
Gimle
4
23.1%
46.4%
Stian Mjøs
Bærum Basket
4
22.4%
65.9%
Grant Sitton
Tromsø Storm
2
22.3%
49.5%
Dennis Valentino Tydeman Nordskag
Nidaros Jets
3
21.6%
43.6%
Aksel Svenkerud-Raundalen
Gimle
2
21.4%
41.9%
Milovan Savic
Gimle
3
21.4%
72.3%
Lars Fredrik Mensah Espe
Gimle
2
21.4%
69.7%
Donnie Tillman
Kongsberg Miners
4
21.2%
39.1%
Per Ingar Berthelsen
TNT Towers
3
20.9%
63.1%
Isak Emanuel Ramirez Nilsen
Tromsø Storm
4
20.5%
51.4%
Kristoffer Gjerde Sætren
Gimle
3
20.3%
42.1%
Henrik Male Davidsen
Ammerud BLNO
3
20.0%
69.8%
Erik Borg
Kongsberg Miners
4
19.9%
77.4%
Kevin Kwame Leraand
Nidaros Jets
4
19.9%
44.2%
Filip Rypdal Øverås
Bærum Basket
4
19.9%
66.2%
Malik Abdul Rauf
Centrum Tigers
2
19.9%
60.0%
Trym Andreas Engelsen
Tromsø Storm
4
18.9%
26.9%
Christopher Jetsadakhon Dalland
Frøya
3
18.4%
76.9%
Troy Barnies
Fyllingen
2
18.4%
52.8%
Sigurd Hakami Sandal
Fyllingen
2
18.2%
42.8%
Joshua Ipalibo Hart
Kongsberg Miners
4
18.1%
64.4%
Martin Døvle Mogeland
Centrum Tigers
2
18.1%
18.2%
Oluwateniola Adegbenro Wood
Ammerud BLNO
3
17.1%
51.2%
Jakob Næss
TNT Towers
4
16.9%
45.1%
Aksel Hvalgård Borg
Frøya
3
16.8%
57.8%
Kevin Austria
Bærum Basket
4
16.5%
48.5%
Pol Olivier Cañadell
Fyllingen
2
16.2%
38.7%
Johannes Benjamin Wangensteen
Frøya
3
16.2%
37.6%
Skage Spernes Eidholm
Centrum Tigers
2
16.2%
41.0%
Jørgen Andreas Lamo
Gimle
4
16.0%
54.6%
Karl Sigurd Madsen
Kongsberg Miners
4
15.9%
43.4%
Vladyslav Unhurian
TNT Towers
3
15.8%
53.3%
Tobias Edvardsen Øvermo
Nidaros Jets
4
15.5%
39.8%
Brage Vejlgaard Sørensen
Kongsberg Miners
4
15.3%
63.3%
Simen Juvastøl
TNT Towers
4
15.2%
27.8%
Odin Akwesi Donkor
TNT Towers
4
14.3%
36.6%
Jo Mathias Bjørnevog
Frøya
3
14.3%
30.4%
Benjamin Dyve
Bærum Basket
4
14.1%
73.4%
Vuk Vucetic
Ammerud BLNO
3
13.5%
43.0%
Rokas Lukas Pocius
Nidaros Jets
4
13.5%
34.0%
Fredrik Kleivdal
Fyllingen
2
13.4%
37.0%
Nikolas Kvåle Skouen
Fyllingen
2
13.0%
12.5%
Anders Isaksen Solem
Tromsø Storm
4
12.8%
63.9%
David Berntsen
Tromsø Storm
4
12.0%
55.9%
Sondre Jacobsen
Frøya
3
11.8%
68.8%
Gustavas Urbonas
Nidaros Jets
4
11.0%
51.3%
Mio Mandt
Ammerud BLNO
3
9.1%
63.4%
Qualified sample: at least 2 games, 15 minutes per game and 8 field-goal attempts.
How to read the chart
The map separates offensive responsibility from scoring conversion. Neither axis is a standalone measure of player value.
Usage · horizontal axis
USG estimates the share of team possessions that end with a player’s field-goal attempt, free throws or turnover, adjusted for team pace and time on court. The player’s game-level rates are weighted by minutes in the season estimate.
True shooting · vertical axis
TS% = points ÷ [2 × (FGA + 0.44 × FTA)]. It combines two-point shots, three-point shots and free throws into one scoring-efficiency rate. It does not account for shot difficulty, playmaking or defensive contribution.
Qualified sample
The reference means are unweighted averages across 75 players who have appeared in at least 2 games, averaged at least 15 minutes and attempted at least 8 field goals. The chart plots 122 players with calculable rates.
Limits and coverage
Coverage runs through 4 October 2026. One game is missing player-level box-score data. Many players have only two to four games, so rates may move quickly as minutes, roles, opponents and shot profiles change. Use this as a scouting prompt alongside game film.